How to use the Waveshare RGB Full-colour LED Matrix Panel for Raspberry Pi Pico - Part 1
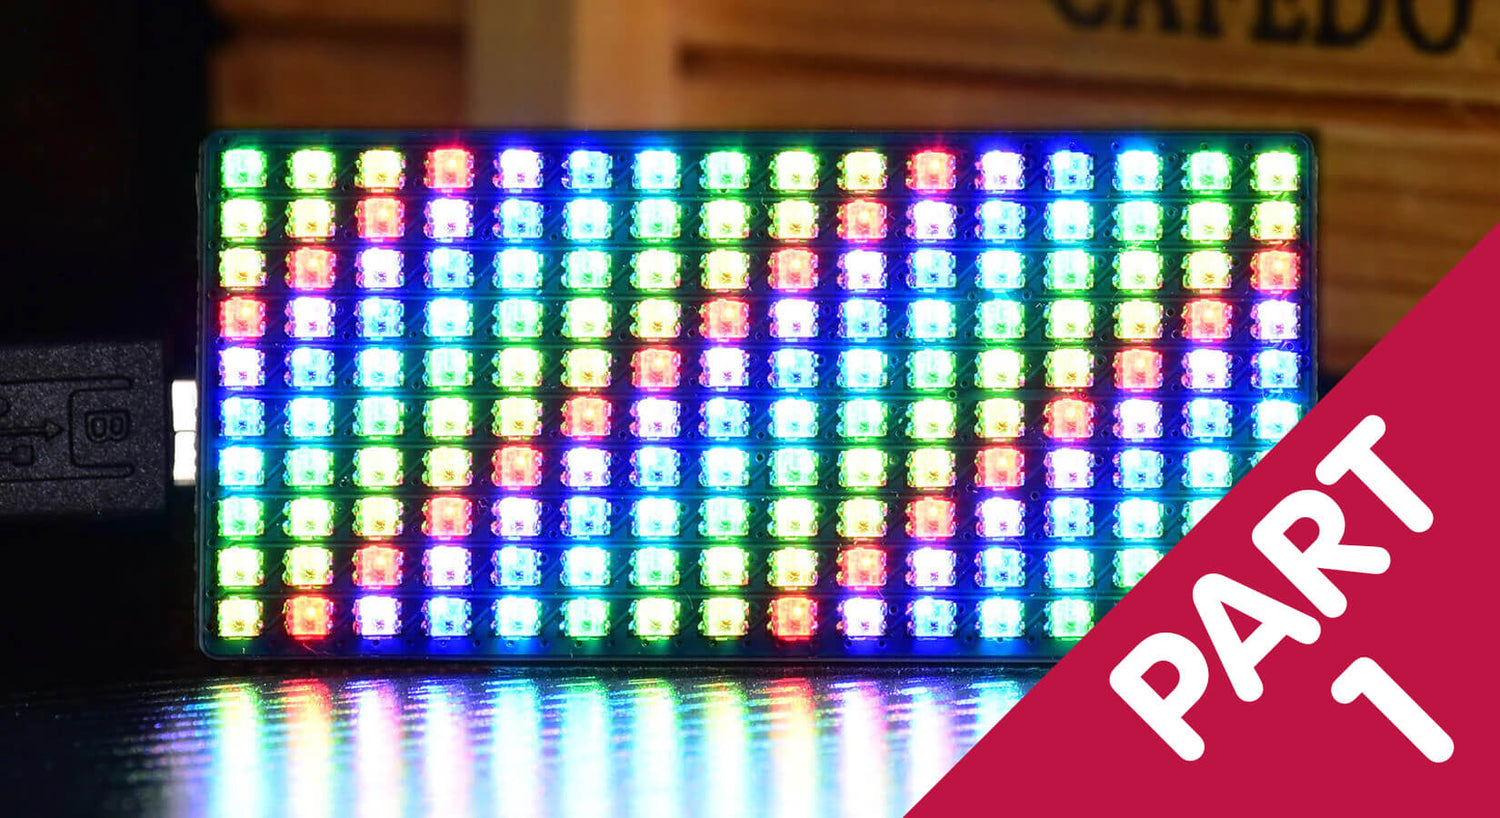
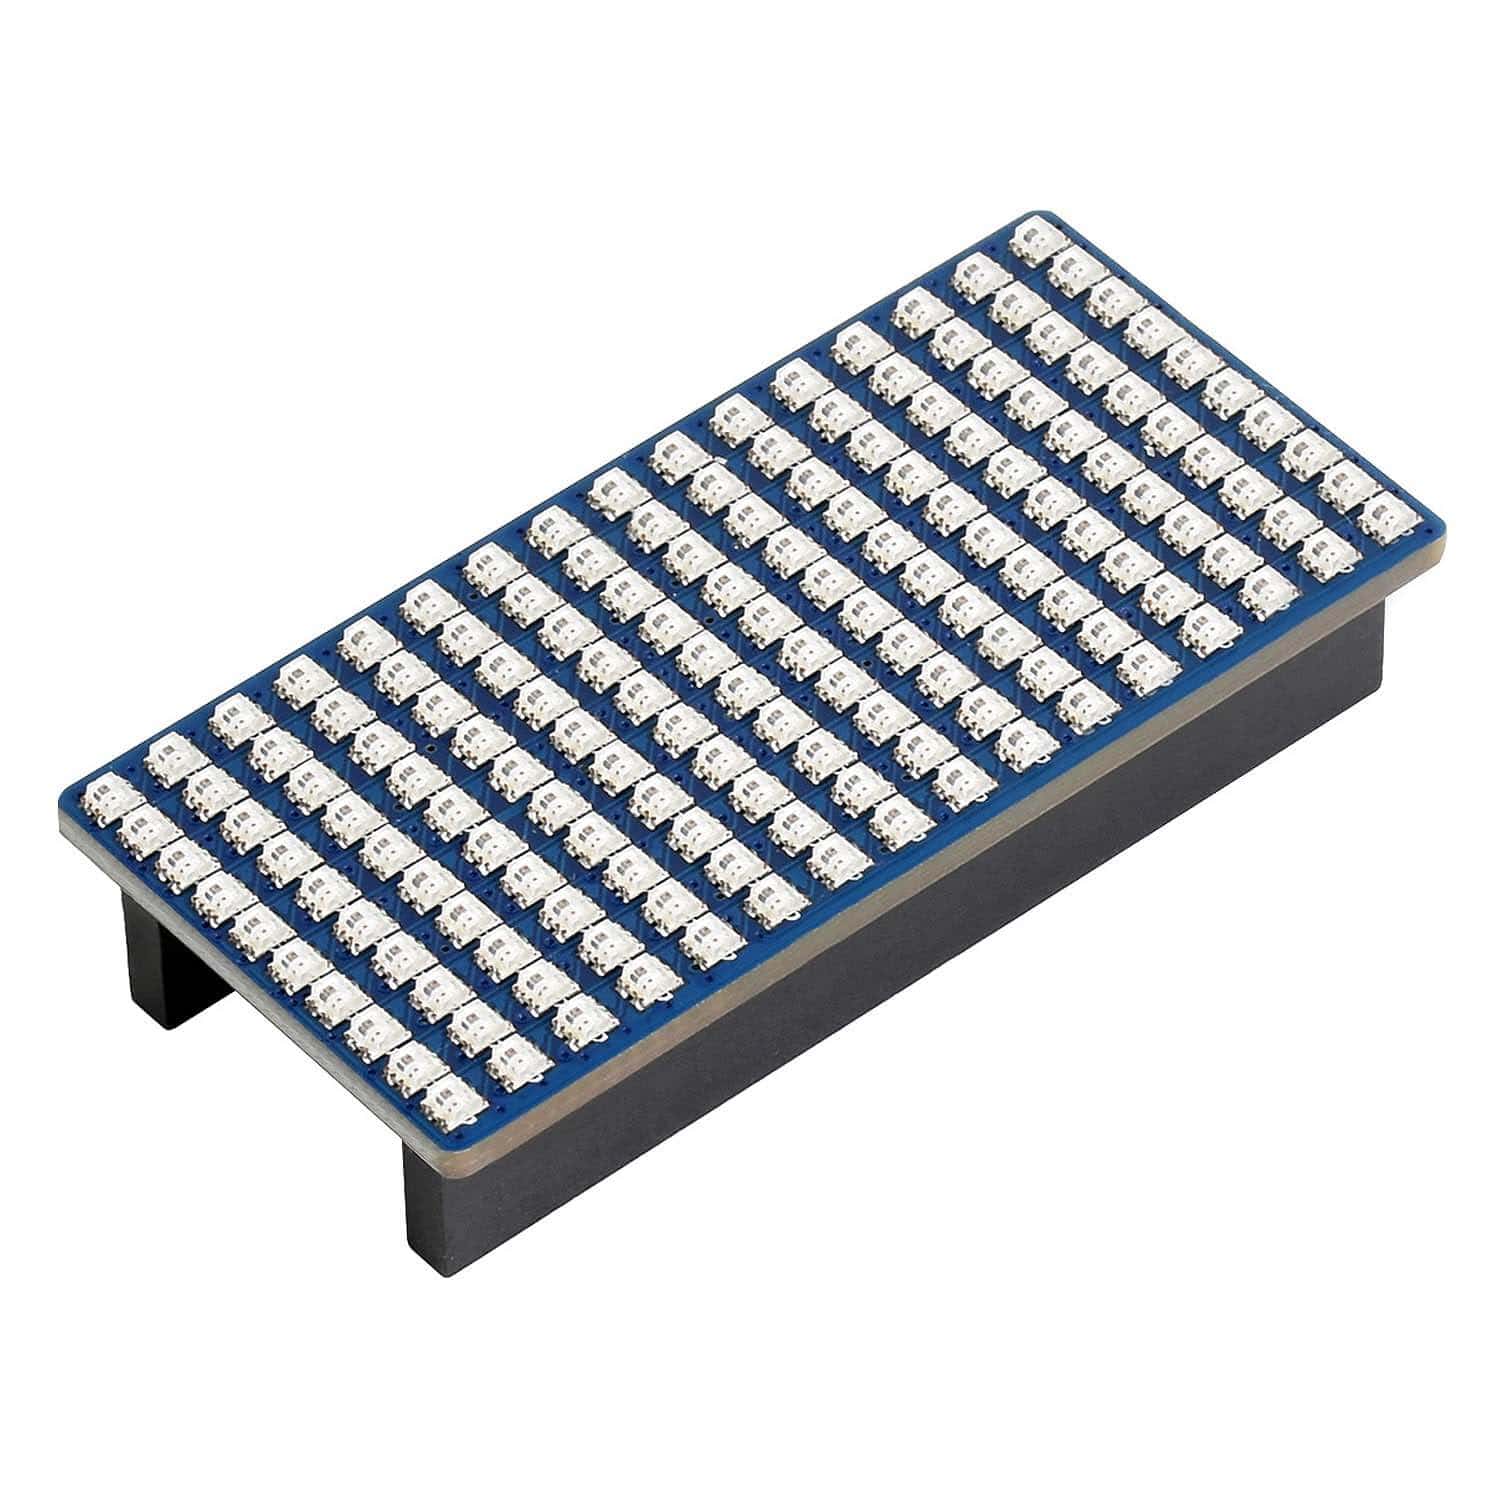
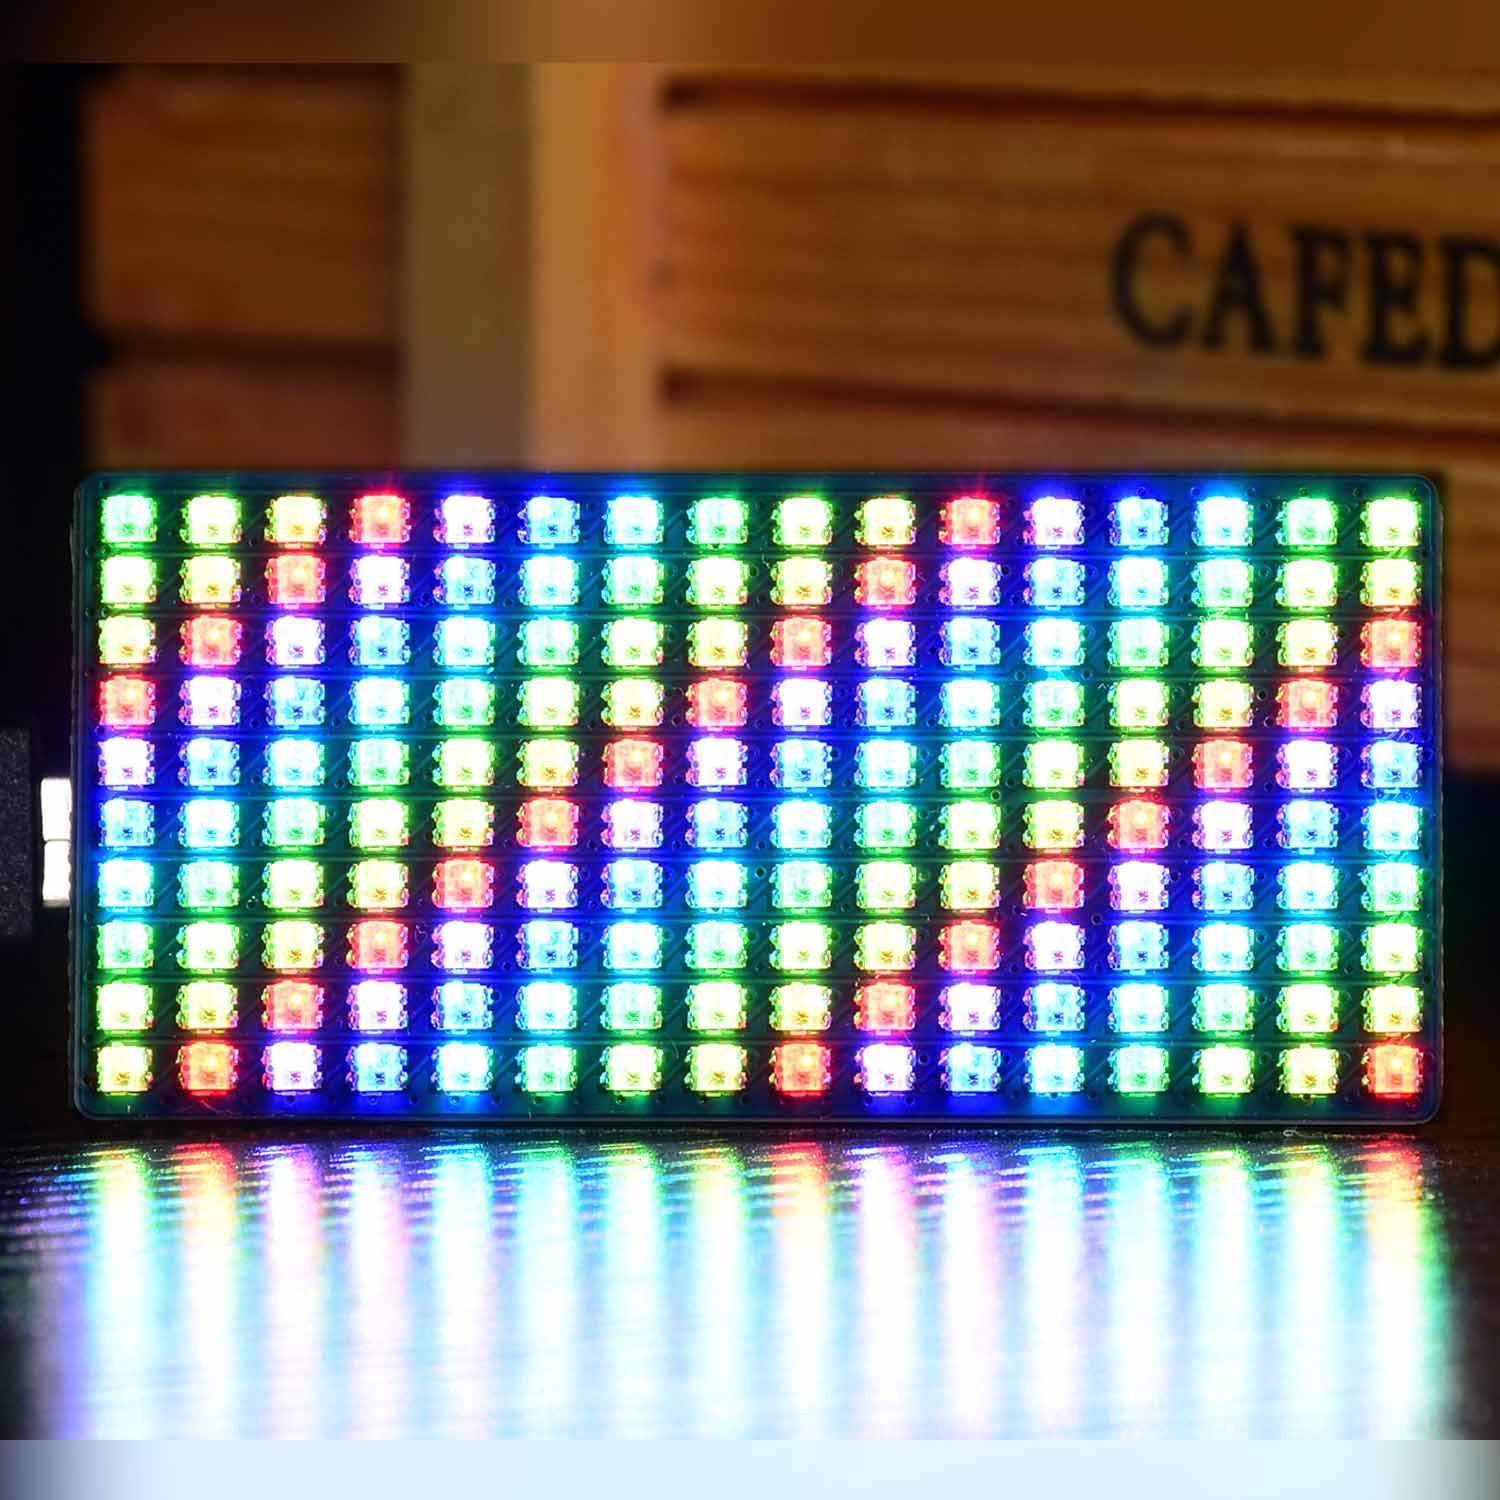
The Waveshare RGB Full-colour LED Matrix board for the Raspberry Pi Pico has 160 RGB LEDs arranged in 10 rows of 16. Each of the 160 LEDs can be set to any one of 16,777,216 colours by specifying each of the red, green and blue components with a number in the range 0 to 255.
The board is bright, colourful and simple to connect to the Pico. It's very easy to program and can even be manually wired to other boards!
This two-part tutorial this show you how to display different colours, values, time, scrolling strings and sensor readings on this display!
What you'll need
For part 1, you'll need:
- Raspberry Pi Pico with Pins
- Thonny installed on your computer
- Micro USB cable – for power and programming the Pico
- Waveshare RGB Full-colour LED Matrix Panel for Raspberry Pi Pico (16x10)
- The ability to enter, edit, save and execute MicroPython code on your Pico using Thonny
In this tutorial we will show you how to:
- Create bright displays of colours using (x, y) co-ordinates
- Display numeric values in decimal, hexadecimal and binary
- Show the time in hours and minutes
Hardware Connection
The hardware connection is very simple. Either plug the board directly onto a Pico or via an expander board. Take care get it the right way round by lining up the USB end correctly:

Alternatively, you can use jumper wires to connect the pins on the underside of the display to your Pico. 5V goes to VBUS, GND to GND and DIN to GP6 or other suitable pin of your choice. There are jumpers on the underside of the board to connect DIN (Data In) to GP6, GP7 or GP22. We linked ours to GP6. 
LED Numbering & Coordinates
If we turn the board so that the USB connection is on the right; then the LEDs are numbered 0 – 15 on the top row moving left to right, 16 - 31 on the second row, and this theme continues until 44 to 159 on the bottom row.
If we use co-ordinates with the top left LED as the origin (0,0) the bottom right LED is at (15,9). From this it is easy to calculate the index/position of any LED on the board with:
pos = x + y * 16
So, the last LED is numbered 15 + 9 * 16 = 159
We’ve written a function to help set specific pixels to the required colour:
def xy_set(x, y, colour):
    # Valid Neopixel check
    if (x >= 0) and (x < 16) and (y >= 0) and (y < 11):
        pos = x + y*16
        pixels_set(pos, colour)
x and y are the co-ordinates of the pixel and colour is a tuple with the red, green and blue values in the range 0 to 255.
What's a Tuple?
Tuples are used to store multiple items in a single variable. Tuple is one of 4 built-in data types in Python used to store collections of data, the other 3 are List, Set, and Dictionary, all with different qualities and usage. A tuple is a collection which is ordered and unchangeable. Tuples are written with round brackets (quoted from w3schools.com).
Tuple Examples
- Red = (255,0,0)
- Green = (0,255,0)
- Blue = (0,0,255)
- Yellow = (255,255,0)
- Cyan = (0,255,255)
- Magenta = (255,0,255)
The brackets are essential! You can get help in finding the RGB values for difficult colours such as brown or pale pink here: https://htmlcolors.com/
We have written several demonstrations programs in MicroPython below to illustrate how the board can be used.
Example 1: Basic colourful flashing LEDs
 You can download the program here: WS Neopixels 160 Basic.py
We suggest you download it and view it in the Thonny Editor. We will provide a commentary (you can print it out from Thonny to add notes or extra comments).
Lines 1 to 49
This is the standard addressable LED driver code provided in the Official Raspberry Pi Pico Guide on page 134.
We set the number of LEDs, the DIN pin and brightness of the display like this:
# Configure the number of WS2812 LEDs.
NUM_LEDS = 160 # 10 rows of 16 Neopixels
PIN_NUM = 6
brightness = 0.1
Provided procedures
pixels_set(i, colour)Changes the colour setting of an LED. Remember that colour is a 3-byte tuple!
pixels_set(159, (0, 127 ,0))Sets the bottom left pixel to mid-green.
pixels_show()Makes the previously set colour values of the pixels visible (forgetting to include this instruction is a common mistake and the display remains unchanged).
We've added a few extra procedures to make programming much easier:
xy_set(x, y, colour)This adjusts the colour setting of the pixel at co-ordinates (x, y). It checks that the position is valid for the display.
pixels_fill(colour)This sets all the pixels to the same colour - tuple.
clear()This sets all the pixels to black
rect(x, y, w, h ,r , g, b)Draws a rectangle outline of width, w, height, h, starting top left at (x, y) with colour values r, g and b.
vert(x, y, l, r, g, b)Draws a vertical line of length, l, in the specified colour
horiz(x, y, l, r, g, b)Draws a horizontal line of length, l, in the specified colour
The main part of the program, lines 87 onward, uses these routines to produce examples of:
pixel order, gradients, lines, rectangles and diagonals.
The gradients are the most complicated with the colours appearing depending on the x position.
# Gradients
clear()
for i in range(16):
    xy_set(i,0,(i*8,0,0))          # Increasing red - left to right
    xy_set(15-i,1,(0,i*8,0))       # Decreasing green
    xy_set(i,2,(0,0,i*8))          # Increasing blue
    xy_set(i,4,((15-i)*8,0,i*8))   # Red to blue
    xy_set(i,6,((15-i)*8,i*8,0))   # Red to green
    xy_set(i,8,(0,i*8,(15-i)*8))   # Blue to green
pixels_show()
utime.sleep(4)
Things to try
- Draw inward pointing triangles at either end of the display
- Draw a large orange arrow on the screen pointing to the right
- Display the arrow in a loop and re-draw it each time in a different random colour
- Using the rectangle procedure, make a show where a rectangle expands and contracts from the centre of the screen. You could add another procedure to ’grow’ the smallest rectangle from 4 pixels in a square from the centre of the screen.
Example 2: Display Numeric values and time
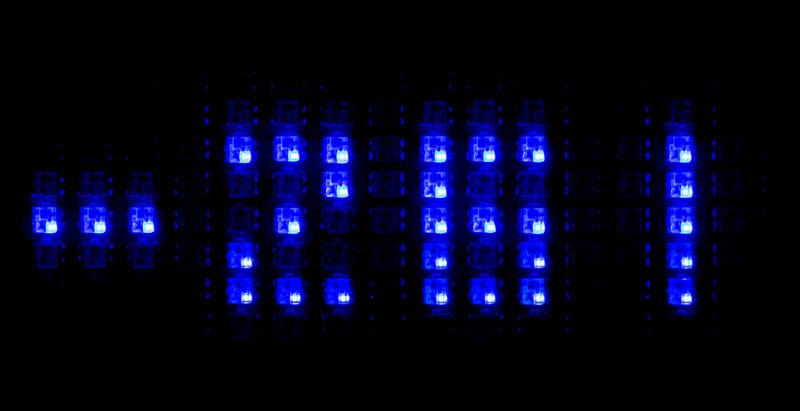
 The second program shows how to display stationary numeric values (see above) on the display in bases 10, 16 and 2 (denary, hexadecimal and binary – base 10, base 16 and base 2) and show the time - hh:mm - like the example below:

You can download the program here: WSNeopixels 160 Numbers.py
This program requires a very small character font. Each character is displayed in a small rectangle 3 pixels wide and 5 pixels high – very small but surprisingly easy to read. We need characters for the digits 0 - 9 and the letters A - F to display hexadecimal numbers.
#one row per 5x3 digit - 0 to 15 - Hexadecimal symbols
nums =[0,1,0,1,0,1,1,0,1,1,0,1,0,1,0,  # 0
       0,1,0,0,1,0,0,1,0,0,1,0,0,1,0,  # 1
       1,1,1,0,0,1,0,1,0,1,0,0,1,1,1,  # 2
       1,1,1,0,0,1,1,1,1,0,0,1,1,1,1,  # 3
       1,0,0,1,0,1,1,1,1,0,0,1,0,0,1,  # 4
       1,1,1,1,0,0,1,1,1,0,0,1,1,1,1,  # 5
       1,1,1,1,0,0,1,1,1,1,0,1,1,1,1,  # 6
       1,1,1,0,0,1,0,1,0,1,0,0,1,0,0,  # 7
       1,1,1,1,0,1,1,1,1,1,0,1,1,1,1,  # 8
       1,1,1,1,0,1,1,1,1,0,0,1,0,0,1,  # 9
       0,1,0,1,0,1,1,1,1,1,0,1,1,0,1,  # A
       1,1,0,1,0,1,1,1,0,1,0,1,1,1,0,  # B
       0,1,1,1,0,0,1,0,0,1,0,0,0,1,1,  # C
       1,1,0,1,0,1,1,0,1,1,0,1,1,1,0,  # D
       1,1,1,1,0,0,1,1,1,1,0,0,1,1,1,  # E
       1,1,1,1,0,0,1,1,1,1,0,0,1,0,0]  # F

powers = [1,2,4,8,16,32,64,128] # For Bin and Hex
The bit pattern for each character is held in a list called nums, starting on line 39. Each character needs 15 ones or zeros. The order is five lines of three values with the top line first. A one represents a pixel switched on and a zero a pixel switched off. We can apply the appropriate colour at a later stage.Looking at zero, in the first line, we have:
 0,1,0,1,0,1,1,0,1,1,0,1,0,1,0,  # 0
0 1 0
1 0 1
1 0 1
1 0 1
0 1 0
We now need some routines to display these patterns as lit pixels on the screen.
def show_num(val,xd,yd,r,g,b):     # Single digit
    offset = val * 15
    for p in range(offset,offset + 15):
        if nums[p] == 1:
            xt = p % 3
            yt = (p-offset) // 3
            xy_set(xt+xd,yt+yd,(r,g,b))
This displays a single numeric character from the font, val, with the top left corner at position (xd, yd) in the colour specified by r, g, b. val needs to be in the range 0 – 15.
The offset is the calculated position of the first 0 or 1 in the table for val. The loop moves through the 15 bits in the table for that character. If the bit equals 1 it calculates the position (xt+xd, yt+yd) and sets that pixel to the required colour. This routine is called, as necessary by the next procedure.
def show_number(val,r,g,b):  #Base 10 - Hundreds, tens and units
    abs_val = abs(val)
    temp = abs_val
    hund = abs_val // 100
    temp = abs_val - hund *100
    tens = temp // 10
    units = temp % 10
    clear()
    if (abs_val > 99): show_num(hund,4,2,r,g,b)
    if (abs_val > 9): show_num(tens,8,2,r,g,b)
    show_num(units,12,2,r,g,b)
This routine draws an integer, val, in the range 0 – 999 on the display in the specified colour.
- The absolute value, always positive, is split into hundreds, tens and units.
- The screen is cleared
- Hundreds, tens and units are displayed as needed using show_num().
def show_utime(hrs,mins,r,g,b):
    clear()
    tens = hrs // 10
    units = hrs % 10
    show_num(tens,0,2,r,g,b)
    show_num(units,4,2,r,g,b)
    show_colon(7,3)
    tens = mins // 10
    units = mins % 10
    show_num(tens,8,2,r,g,b)
    show_num(units,12,2,r,g,b)
This routine uses similar methods to display a time in hours and minutes with a colon between the values like the example below:
powers = [1,2,4,8,16,32,64,128] # For Binary

def show_binary(val,r,g,b):
    for index in range(0, 8):
        if powers[index] & val:
            xy_set(11-index,9,(r,g,b)) # Coloured
        else:
            xy_set(11-index,9,(0,0,0)) # Black

def show_hex(val,r,g,b):
      nibble_hi = val // 16   # A nibble/nyble is half a byte
      nibble_low = val % 16
      show_num(nibble_hi,4,2,r,g,b)
      show_num(nibble_low,8,2,r,g,b)
These routines display values in hexadecimal and binary.
The main part of the program calls on these routines to demonstrate the various formats. During the counting section the colour of negative values and the minus sign are applied.
Things to try
Read the Pico's Temperature
Read the temperature from the sensor built into the Pico and display the integer part on the LEDs with the letter C.
import machine
import utime
sensor_temp = machine.ADC(4)
conversion_factor = 3.3 / (65535)

while True:
    reading = sensor_temp.read_u16() * conversion_factor
    temperature = 27 - (reading - 0.706)/0.001721
    print(temperature)
    utime.sleep(2)
This is not very accurate and we always find the values too high. You could use a temperature sensor such as a DHT11, DHT22, TMP36 or DS18B20 to improve the accuracy of your output.
Build a digital clock
Use a one second ‘ticker-timer’ or utime.ticks_ms() to build a digital clock with the display to make it easily visible. Using time.sleep(1) between display updates will run too slowly as the screen setting and updating takes a short time. See page 73 of the Pico Guide for utime.ticks_ms() help.
Use a Real-time Clock
For greater accuracy and ease of setting use a RTC (Real Time Clock) such as the DS1302 or DS3231.
Bouncing pixel
#========== MAIN ===============
x = 4   # x position
xd = 1  # x direction
y = 5   # y position
yd = 1  # y direction

clear()
xy_set(x,y,(280,0,0))
pixels_show()
while True:
    clear()
    x = x + xd
    if x > 14:
        xd = -1
    elif x < 1:
        xd = 1
    xy_set(x,y,(280,0,0))
    pixels_show()
utime.sleep(0.1)
You can download the full program here: WS Neopixels 160 Bounce.py
Run the program and you will see a single red pixel moving horizontally across the screen. When it reaches the edge, it bounces back!
Modifications to try
- Add code to make it move diagonally by updating the y value in the loop and bounce off the top and bottom edges as well
- Change the colour of the pixel depending on which direction it is travelling
- Draw a grey frame round the edge of the screen and make it bounce off that
- Increase the size of the bouncing object to a square of 4 pixels
Coming up in Part 2
In part 2 of this tutorial we will show you how to scroll colourful text and numeric values across the screen using an extended character set. We'll also cover how to display sensor readings from a BME680 temperature sensor!
Don't forget to check out our Raspberry Pi Pico section for more great add-ons and accessories!
About the Author
This article was written by Tony Goodhew. Tony is a retired teacher of computing who starting writing code back in 1968 when it was called programming - he started with FORTRAN IV on an IBM 1130! An active Raspberry Pi community member, his main interests now are coding in MicroPython, travelling and photography.


