
Coding Graphics with MicroPython on Raspberry Pi Pico Displays
In one of our previous tutorials we explained how to control colour on Waveshare Raspberry Pi Pico LCD displays.
In this tutorial Tony Goodhew explains how to use the basic graphics procedures which are included in the display driver, and for the ambitious makers out there he also provides examples for advanced shapes and graphics!
This can be really handy for making your own interfaces, data displays and other fun projects with many of our Waveshare Pico LCDs.
What you’ll need
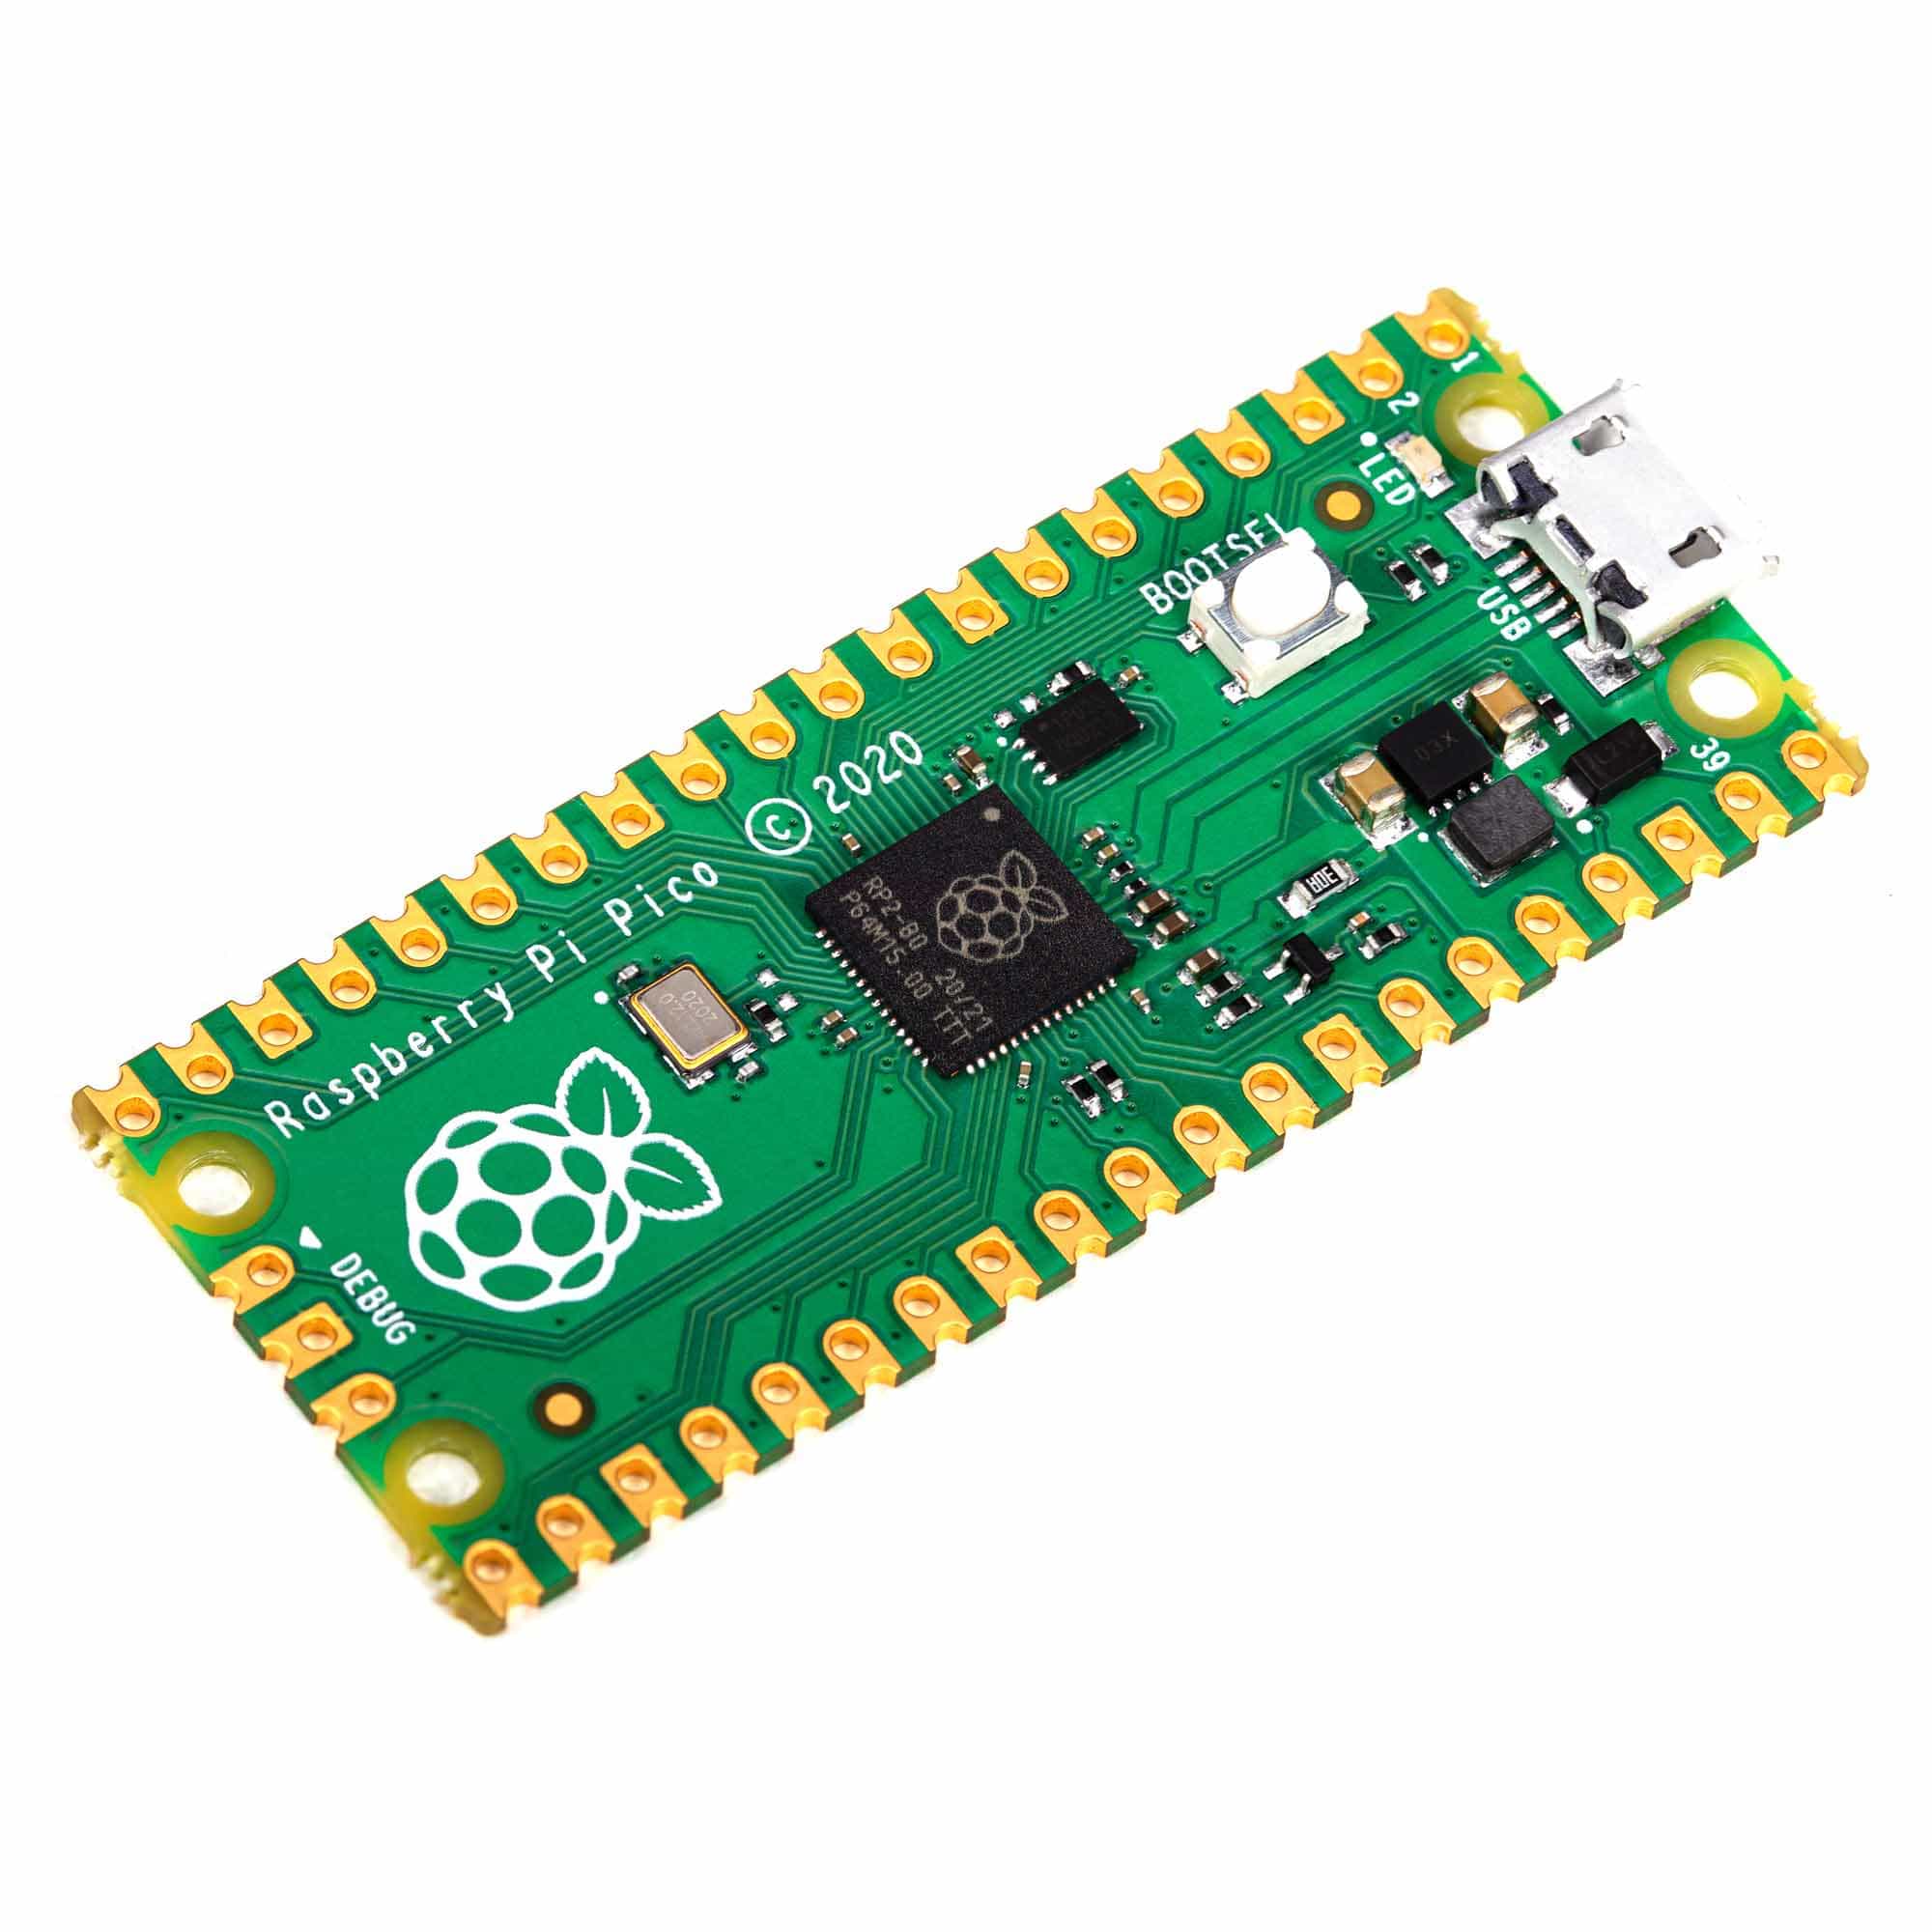
- Raspberry Pi Pico with pins soldered
- Micro-USB cable – for power and programming the Pico
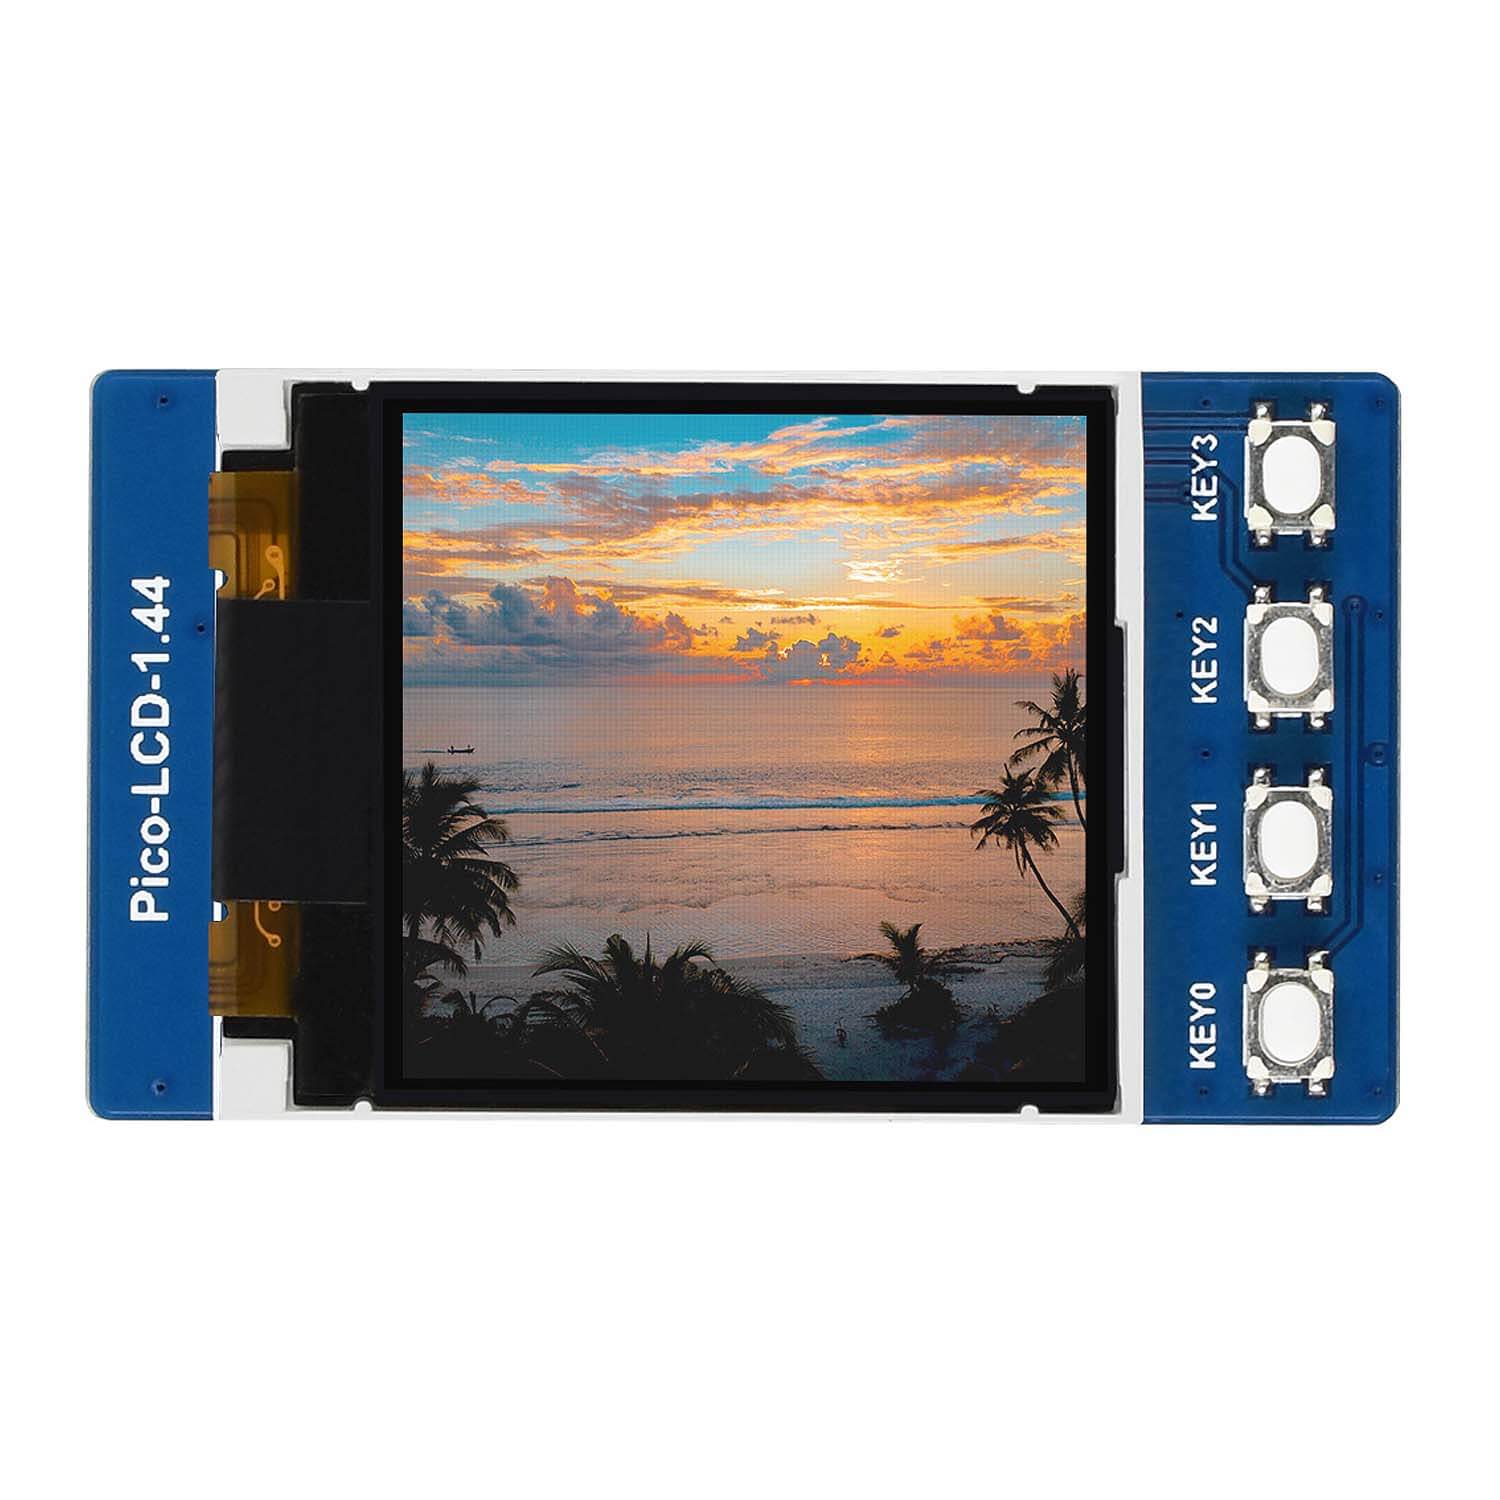
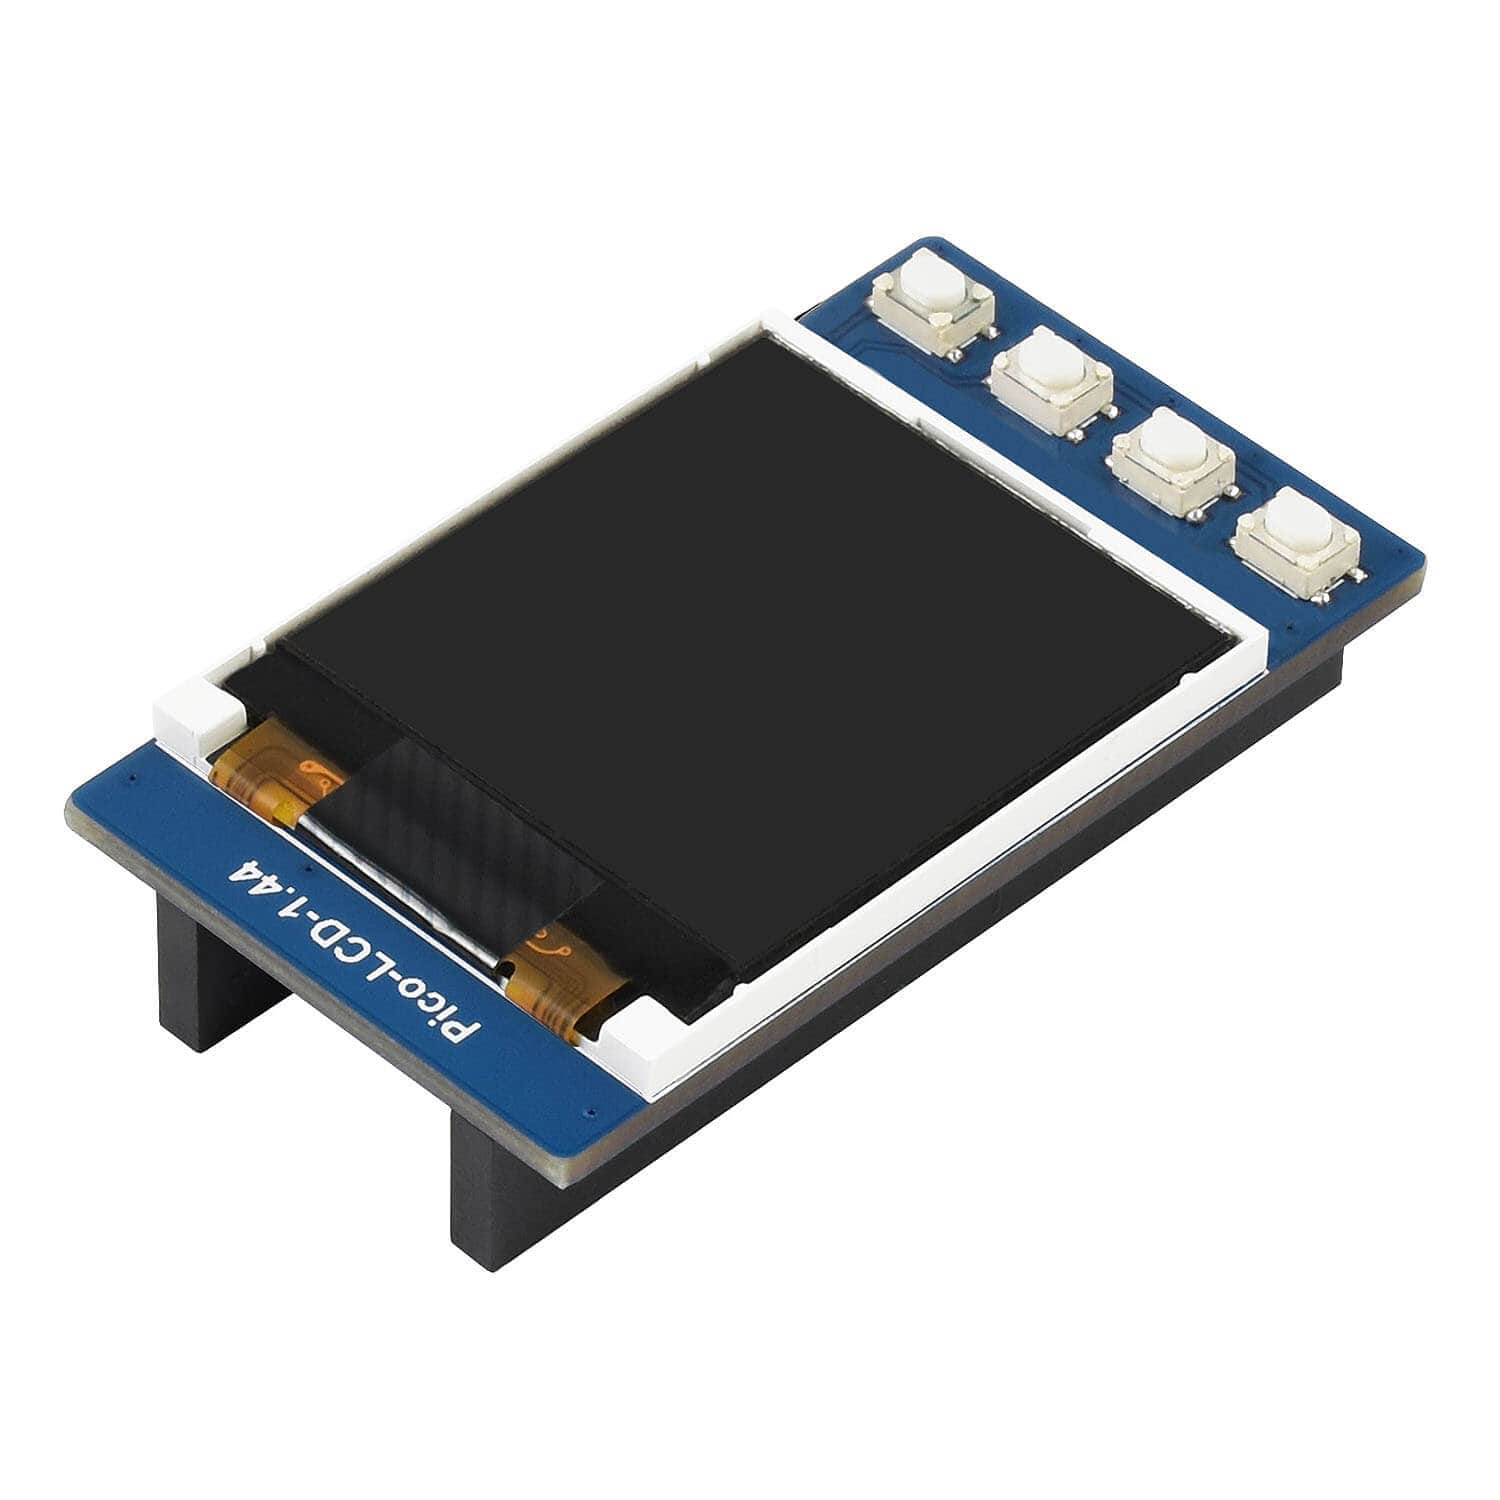
- A Waveshare Pico LCD Display and driver software
- Thonny installed on your computer
- The ability to enter, edit, save and execute MicroPython code on your Pico using Thonny
- Optional: 10K ohm potentiometers, breadboard, jumper wires, Pico Decker/Duo and tactile buttons.
We are going to use the Waveshare 1.44” 128x128 Pico display but any of the others will also work in the same way.

Getting started
A simple instruction to illuminate an identified pixel (x, y) with a specific colour is all that is needed to build a graphics system.
All the other graphical and text objects we would like to display can be built from this single pixel instruction; such as lines, circles, rectangles, triangles and text strings at different sizes.
This is all carried out with code. Display manufacturers usually supply some of these procedures/methods but leave the rest up to the end user to construct.
Imports
At the top of our driver program we will always import a minimal set of libraries using this block at the top of our MicroPython script (we add even more later when we want to do advanced programs):
from machine import Pin,SPI,PWM
import machine
import framebuf
import utime
import gc
The third line here imports the Framebuffer library which includes several very useful routines to draw objects on the display. The garbage collection library, gc, has also been imported so that we can check how much memory is available.
Basic starter examples
Let's start with a few simple examples of the code that follows this import block.
The line below places the 16-bit colour code into the buffer at the position of the pixel(x, y).
lcd.pixel(x, y, c)for x in range(25):
lcd.pixel(x, 5, colour(255,0,0))
lcd.show()
Drawing primitive shapes

The following methods draw shapes (such as those above) onto the FrameBuffer. They only become visible to the user once the lcd.show() instruction is executed.
The following is from the Micropython documentation:
lcd.fill(c)
Fill the entire display with the specified colour.
lcd.pixel(x, y[, c])
If c is not given, get the colour value of the specified pixel – useful for collision detection in a game. If c is given, set the specified pixel to the given colour.
For example:
lcd.pixel(25, 30, colour(0,255,0)) # Colours pixel (25, 30) green
pc = lcd.pixel(45, 50) # Gets the colour of the pixel at (45, 50)
lcd.vline(x, y, h, c)
lcd.hline(x, y, w, c)
lcd.line(x1, y1, x2, y2, c)
Draw a line from a set of coordinates using the given colour and a thickness of 1 pixel. The line method draws the line up to a second set of coordinates whereas the hline and vline methods draw horizontal and vertical lines respectively up to a given length.
lcd.rect(x, y, w, h, c)
lcd.fill_rect(x, y, w, h, c)
Draw a rectangle at the given location, size and colour. The rect method draws only a 1-pixel outline whereas the fill_rect method draws both the outline and interior.
lcd.text(s, x, y[, c])
Write text to the FrameBuffer using the coordinates as the upper-left corner of the text. The colour of the text can be defined by the optional argument but is otherwise a default value of 1. All characters have dimensions of 8x8 pixels and there is currently no way to change the font.
lcd.scroll(xstep, ystep)
Shift the contents of the FrameBuffer by the given vector. This may leave a footprint of the previous colours in the lcd.
FrameBuffer.blit(fbuf, x, y, key=- 1, palette=None)
Draw another FrameBuffer on top of the current one at the given coordinates. If key is specified then it should be a colour integer and the corresponding colour will be considered transparent: all pixels with that colour value will not be drawn.
Example Shape Programs
We've provided some basic example programs to drive some of the popular boards here (rename the files if your download adds weird characters):
- WS 0-96 160x80 MIN.py
- WS 1-3 240x240 MIN.py
- WS 1-8 160x128 New Driver MIN.py
- WS 1-44 128x128 MIN.py
- WS 2-0 320x240 MIN.py
Each program contains the screen driver code, sets up the buttons/joystick (if applicable), sets the width and height variables, loads the essential libraries, defines the colour (R, G, B) and clear (c) procedures, then displays some colour checking text like this:

Some things for you to try
- Using lcd.vline and lcd.hline draw a blue border round the edge pixels on your screen. Wait 3 seconds and place a single, white pixel in each corner.
- Using lcd.rect, change the outline to red with yellow corner dots.
- Using lcd.fill_rect, fill the whole screen green and then fill the middle of the screen black, leaving a 10 pixel border. Put red 10-pixel squares in each corner.
- Draw diagonal lines in blue across the screen from opposite corners and a yellow, filled square, 21 pixel wide, near the centre. Draw an orange outline diamond touching the centre points of the sides of the square.
- Write your name in the middle of the screen and scroll it up, left, down, right and diagonally 15 pixels, finishing where you started.
- Draw a dark grey rectangle in the centre of the screen. Draw 500 white pixels inside the square, none touching the edge. (Random was explained in the previous display tutorial.)
Extended graphics routines
Now let's look at some more advanced graphics routines - hold on to your butts!
We've provided some optimised extended graphics example programs to drive some of the popular boards here. Download the file for your board then read on (rename the files if your download adds weird characters at the end):
- WS 0-96 160x80 GFX-T2.py
- WS 1-3 240x240 GFX-T2.py
- WS 1-8 160x128 New Driver GFX-T2.py
- WS 1-44 128x128 GFX-T2.py
- WS 2-0 320x240 GFX-T2.py
These programs introduce some extended procedures to draw filled and outline triangles, circles and rings. The routines are quite complex but you can use them without fully understanding how they work (but we encourage you to play with them, break them and learn!).
The filled triangle code takes up a great deal of memory but it is very useful as any filled polygon can be broken down into a series of triangles.
Extended graphics breakdown
Here's an explanation of some of the key lines of code you'll see in the files above.
def triangle(x1,y1,x2,y2,x3,y3,c): # Draw outline triangle
This one is simple, it just draws three lines:

def tri_filled(x1,y1,x2,y2,x3,y3,c): # Draw filled triangle
This is routine is very complicated. It splits the original triangle into two with a horizontal line and then fills them in. If you uncomment all the # lcd.show() lines and sleep instructions it will slow right down and you can see it working (unfortunately, the 2” display needs such a large buffer that there is not enough memory for the filled triangles code):

def circle(x,y,r,c):
This draws a filled circle with centre (x, y) and radius r using the Theorem of Pythagoras:

def ring(x,y,r,c):
This draws an empty circle with centre (x, y) and radius r:

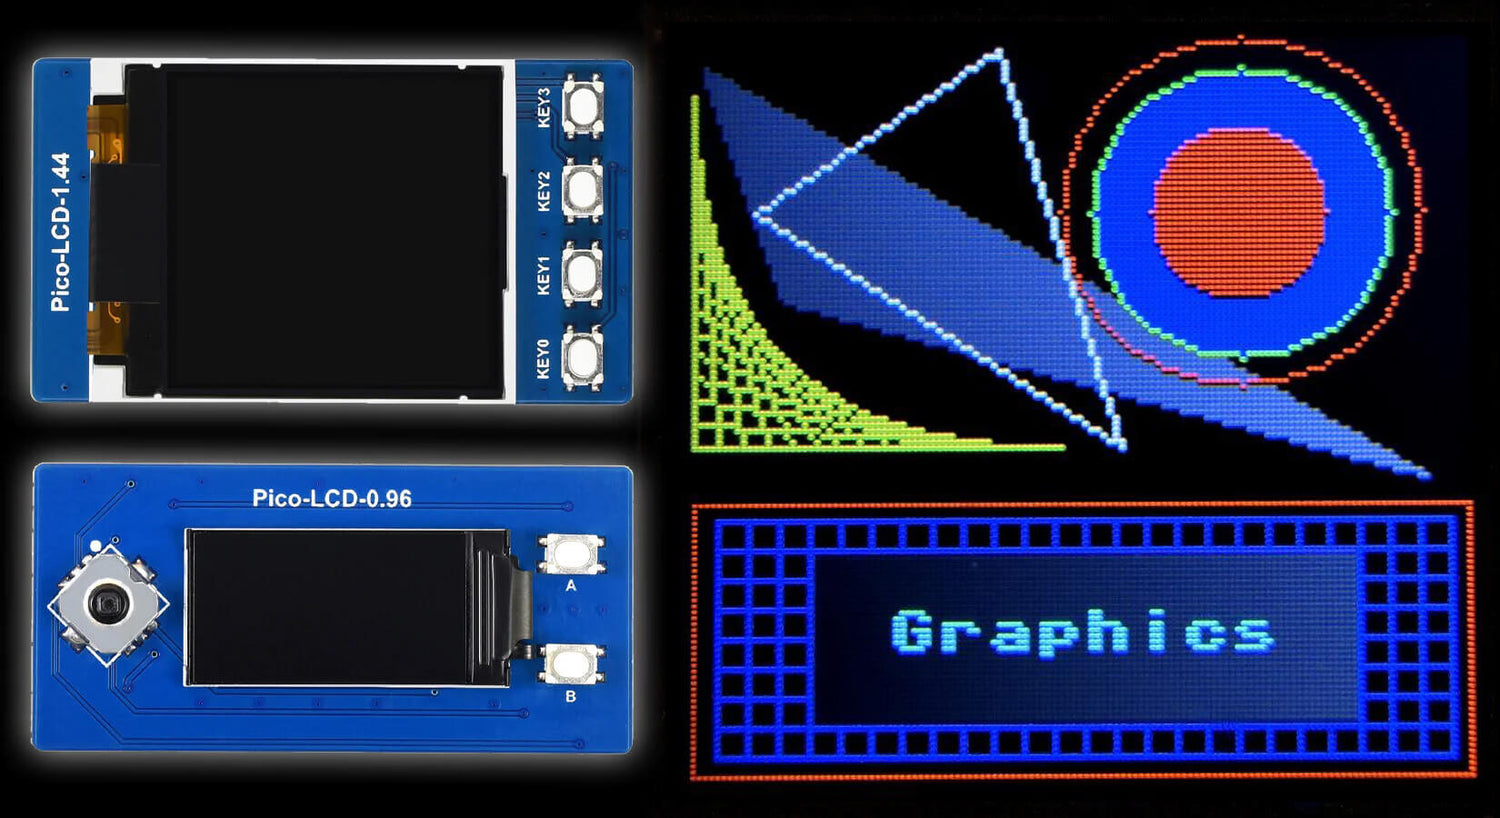
1.44" extended graphics example
Here is a video of the program running on the 1.44” display:
Extended graphics program layout
Imports
For the imports we added the math library as this is needed for Sin and Cos in graph plotting. The random library has also been imported, for the randomly generated triangles. These are followed by the basic LCD board setup we covered earlier.
from machine import Pin,SPI,PWM
import framebuf
import utime
import gc
import math
import random
Title Screen
Here we build the title screen. Notice that the blue stars are added later:
# Title screen
clear(0)
lcd.show()
lcd.text("Graphics",5,10,colour(200,0,0))
cc = colour(200,200,0)
lcd.text("Triangles",24,30,cc)
lcd.text("Circles",24,40,cc)
lcd.text("Rings",24,50,cc)
lcd.text("Rectangles",24,60,cc)
lcd.text("and Lines",24,70,cc)
for y in range(5):
lcd.text("*",13,y*10 + 30,colour(0,0,255))
lcd.show()
utime.sleep(2)
lcd.fill(0)

Graphics & Shapes
The next section draws the rectangles and the graphics text:
# Built into framebuf library with the basic font
lcd.rect(0,80,128,47,colour(255,0,0))
lcd.show()
utime.sleep(0.6)
for x in range(4,125,5):
lcd.vline(x,82,40,colour(0,0,255))
for y in range(82,125,5):
lcd.hline(4,y,121,colour(0,0,255))
lcd.fill_rect(20,88,89,29,colour(50,50,50))
lcd.text("Graphics",32,98,colour(0,255,255))
lcd.show()
utime.sleep(1)
The triangles section is the next to load:
# Triangle
x1 = 2
y1=5
x2=15
y2=45
x3=120
y3=75
c = colour(90,90,90)
triangle(x1,y1,x2,y2,x3,y3,c)
lcd.show()
utime.sleep(1)
tri_filled(x1,y1,x2,y2,x3,y3,c)
lcd.show()
utime.sleep(1)
triangle(10,30,50,2,70,70,colour(255,255,255))
lcd.show()
utime.sleep(1)

Circles and Rings
The circles and rings section displays next:
# Circle & Ring
c = colour(0,0,255)
ring(90,30,25,c)
lcd.show()
utime.sleep(1)
circle(90,30,25,c)
lcd.show()
utime.sleep(1)
c = colour(0,255,0)
ring(90,30,25,c)
lcd.show()
utime.sleep(1)
c=colour(255,0,0)
ring(90,30,30,c)
lcd.show()
utime.sleep(1)
c = colour(255,0,0)
circle(90,30,15,c)
lcd.text(chr(227),85,25,colour(225,0,0))
lcd.show()
...followed by yellow tread art demonstrating lines drawn at an angle – slower than vline and hline:
# Thread art
for i in range(0,61,4):
lcd.line(0,10+i,i,70,colour(255,255,0))
lcd.show()
utime.sleep(1)

Sine and Cosine
Plotting Sine and Cosine curves requires quite a bit of complicated mathematics, using the math library, but it demonstrates the use of single pixels:
# Graphs - Sine and Cosine
clear(0)
lcd.show()
c = colour(80,80,80)
factor = 361 / width
lcd.hline(0,40,160,c)
lcd.show()
c = colour(255,0,0)
for x in range(0,width):
y = int ((math.sin(math.radians(x * factor)))* -30) + 40
lcd.pixel(x,y,c)
lcd.show()
lcd.text("Sine", 5, 65, colour(255,0,0))
lcd.show()
utime.sleep(1)
lcd.show()
c = colour(80,80,80)
lcd.hline(0,40,160,c)
lcd.show()
c = colour(0,255,0)
for x in range(0,width):
y = int((math.cos(math.radians(x * factor)))* -30) + 40
lcd.pixel(x,y,c)
lcd.text("Cosine",60,10,colour(0,255,0))
lcd.show()
utime.sleep(5)

Simple Scrolling
Here we demonstrate the simple scrolling:
clear(0)
lcd.text("Scrolling",2,2,colour(255,255,0))
lcd.show()
utime.sleep(0.8)
for i in range(15):
lcd.scroll(2 * i, i)
lcd.show()
utime.sleep(0.3)
# 30 random triangles
c = colour(200,0,0)
for i in range(30):
clear(0)
c=colour(200,0,0)
x1 = random.randint(2,width-3)
x2 = random.randint(2,width-3)
x3 = random.randint(2,width-3)
y1 = random.randint(2,height-3)
y2 = random.randint(2,height-3)
y3 = random.randint(2,height-3)
tri_filled(x1,y1,x2,y2,x3,y3,c)
c=colour(0,200,0)
triangle(x1,y1,x2,y2,x3,y3,c)
c=colour(0,0,200)
lcd.text(str(i),110,5,c)
lcd.show()
utime.sleep(0.6)
clear(0)
lcd.text("Done",45,40,colour(255,0,0))
lcd.show()
utime.sleep(3)
clear(0)
lcd.show()
Things to try
- Display blue ‘thread art’ in the top left and bottom right corners of the screen.
- In the centre of the screen display a ‘bull’s eye’ circular target with a ‘gold’ centre, 4 other colours and scores 10, 8, 6, 4 and 2 written in the appropriate positions.
- Draw 50 random triangles in random colours on the screen, fast, without screen clearing.
- Draw 50 random circles in random colours on the screen, fast, without screen clearing.
- On the left of the screen draw a green arrow pointing to the right and scroll it off the screen to the right.
- Draw four magenta arrows pointing into the four corners of the screen (each arrow needs 3 filled triangles – one for the head and two for the shaft).
Dynamic bar graph project
This needs buttons on three pins. If your board does not have buttons included connect some up on a breadboard.
Start with the MIN program you saved earlier. Save it with the name Bar.py. Delete the main part of the program and paste in this code. It allows us to control a variable, v, in the range 0 to 100 with two buttons. You can also halt the program with the third button.
# ==== Board now setup ========== MAIN BELOW====================
lcd.text("Bar Graph",5,5,colour(255,0,0)) # Title
lcd.vline(9,16,30,colour(200,0,0)) # Base line
lcd.vline(8,16,30,colour(200,0,0))
v = 50 # Initial value
running = True # Loop control
while running:
# Update v if button pressed
if key3.value() == 0:
v = v + 1
if v > 100:
v = 100
if key2.value() == 0:
v = v - 1
if v < 0:
v = 0
lcd.fill_rect(10,20,100,60,0) # Rub out Bar and percentage with background
lcd.fill_rect(10,20,v,20,colour(200,200,200)) # Draw new Bar
lcd.text(str(v) + " %",35,50,colour(200,2000,0)) # Update percentage
lcd.show()
utime.sleep(0.01)
# Halt now?
if key0.value() == 0:
running = False # Stop looping
# Tidy Up ============
pwm.duty_u16(32768)# HALF BRIGHTNESS
clear(0)
lcd.show()

Things to note
- The title and base line are only draw once – before the loop starts.
- We do not clear the whole screen in the loop and re-draw everything.
- We overwrite the bar and the percentage with a background-coloured rectangle before updating. Only they are changing.
- There is only one lcd.show() in the loop.
- The loop is controlled by the Boolean variable, running. Changing its value, from True to False, halts the looping.
We could add an extra check to see if we need to update the display. We only need to update if the value of v has changed by pressing a button.
The following version includes the check:
# ==== Board now setup ========== MAIN BELOW====================
lcd.text("Bar Graph",5,5,colour(255,0,0)) # Title
lcd.vline(9,16,30,colour(200,0,0)) # Base line
lcd.vline(8,16,30,colour(200,0,0))
v = 50 # Initial value
oldv = 999
running = True # Loop control
while running:
# Update v if button pressed
if key3.value() == 0:
v = v + 1
if v > 100:
v = 100
if key2.value() == 0:
v = v - 1
if v < 0:
v = 0
if v != oldv:
lcd.fill_rect(10,20,100,60,0) # Rub out Bar and percentage with background
lcd.fill_rect(10,20,v,20,colour(200,200,200)) # Draw new Bar
lcd.text(str(v) + " %",35,50,colour(200,2000,0)) # Update percentage
lcd.show()
oldv = v
utime.sleep(0.01)
# Halt now?
if key0.value() == 0:
running = False # Stop looping
# Tidy Up ============
pwm.duty_u16(32768)# HALF BRIGHTNESS
clear(0)
lcd.show()
Note: oldv is initialised with a ‘rogue’ value to force the lcd.show() in the first run of the loop.
Things to try
- Change the bar from horizontal to vertical.
- Change the input from buttons to UP and DOWN on a joystick, if available.
- Add a scale to the bar graph - a tick for every 10 pixels along the top edge of the bar.
- Change the input to a potentiometer with 0 to 100 range.
- Update the colour mixing program, from the colour tutorial, to show the red, green and blue values as coloured bar graphs.
- Use a joystick to move a circular ball round the screen.
- Bounce a small square or circle around the confines of the screen. You could also add an edge border.
You may have noticed that on some screens the text is very small and difficult to read. In a following tutorial will add an extra font, with more characters, which we can display in different sizes.
About the Author
This article was written by Tony Goodhew. Tony is a retired teacher of computing who starting writing code back in 1968 when it was called programming - he started with FORTRAN IV on an IBM 1130! An active Raspberry Pi community member, his main interests now are coding in MicroPython, travelling and photography.
8 comments
Ipsleylodger
One extra question, how do I adjust the brightness of the display. I have seen it somewhere but can’t find it.
Peter
One extra question, how do I adjust the brightness of the display. I have seen it somewhere but can’t find it.
Peter
Ray
how do you read pixels
how do you read pixels
Kees
It is fantasic that I may follow this tutorial.
However as a very beginner with a Pimoroni Explorer board (bootloader succesfully uploaded version 1.23.0) in front of me I tried to start below “Getting started”
So I copied the lines:
"
from machine import Pin,SPI,PWM
import machine
import framebuf
import utime
import gc
"
and the next lines:
"
lcd.pixel(x, y, c)
for x in range(25):
    lcd.pixel(x, 5, colour(255,0,0))
lcd.show()
"
with th copy button.
Running the program Thonny reported an error:
NameError: name ‘lcd’ isn’t defined
This is of course a very basic error, but I do not know yet why this error is given.
I suppose that these lines in the tutorial are checked.
More below the page I had also copied a piece of program and there Thonny gave the error:
“clear(0) not defined”
My first basic question should be where I can find which first toplines (libraries?) I do have to use before I start programming.
Maybe in one of the “import” -s there should be found a definition of LCD or clear(0)?
I appreciate any help to make the next step.
Thank you in advance for your help.
It is fantasic that I may follow this tutorial.
However as a very beginner with a Pimoroni Explorer board (bootloader succesfully uploaded version 1.23.0) in front of me I tried to start below “Getting started”
So I copied the lines:
"
from machine import Pin,SPI,PWM
import machine
import framebuf
import utime
import gc
"
and the next lines:
"
lcd.pixel(x, y, c)
for x in range(25):
lcd.pixel(x, 5, colour(255,0,0))
lcd.show()
"
with th copy button.
Running the program Thonny reported an error:
NameError: name ‘lcd’ isn’t defined
This is of course a very basic error, but I do not know yet why this error is given.
I suppose that these lines in the tutorial are checked.
More below the page I had also copied a piece of program and there Thonny gave the error:
“clear(0) not defined”
My first basic question should be where I can find which first toplines (libraries?) I do have to use before I start programming.
Maybe in one of the “import” -s there should be found a definition of LCD or clear(0)?
I appreciate any help to make the next step.
Thank you in advance for your help.
Ami
Is there a way to draw simple images/shapes on these displays?
Is there a way to draw simple images/shapes on these displays?
Ken
Has anyone rewritten these Python shape drawing routines into a C-compiled UF2? I’m also looking for a framebuff exporter to output the frame buffer to a file that can then be converted to a PPM or something similar.
Has anyone rewritten these Python shape drawing routines into a C-compiled UF2? I’m also looking for a framebuff exporter to output the frame buffer to a file that can then be converted to a PPM or something similar.
Wen
Can I display live video on it?
Can I display live video on it?
The Pi Hut
@Maximilian K The tutorials are specifically using a range of Waveshare displays but similar displays with the same spec/drivers should work – you’ll need to update the code with the correct display size though
@Maximilian K The tutorials are specifically using a range of Waveshare displays but similar displays with the same spec/drivers should work – you’ll need to update the code with the correct display size though
Maximilian K
None of the code worked…
Could this be because i have a mini OLED display?
None of the code worked…
Could this be because i have a mini OLED display?